
Aggie UX Web Design System
Aggie UX is Texas A&M’s web design system. It provides a unified framework of components, templates and guidance to help you build consistent, accessible and brand-compliant websites across the university.

Requests and Resources
Site Launches
Schedule a launch readiness review and request assistance with your site launch.
Bugs and Issues
Let us know if something is broken or isn’t working as expected in Aggie UX.
Submit Ideas
Have an idea to make Aggie UX better? Let us know!
Access Training
Join our monthly office hours and learn from experts about Aggie UX and all things web at Texas A&M. Other training resources are available on demand through this website and Canvas LMS.
Stay Connected
Join the Aggie UX mailing list and follow #aggie-ux on Slack (available to Texas A&M University employees only) to stay up-to-date on Aggie UX design system enhancements and updates.
Aggie UX Role-Based Resources
Aggie UX for Designers
Discover design resources that make it easy to quickly create webpage mockups using the Aggie UX design system.
View Aggie UX design resourcesAggie UX for Developers
Learn more about Aggie UX Cascade page builder, WordPress theme and developing your own websites using the web design system.
View Aggie UX developer resourcesAggie UX for Content Creators
Read more about writing accessible web content and view documentation for updating websites.
View Aggie UX content resources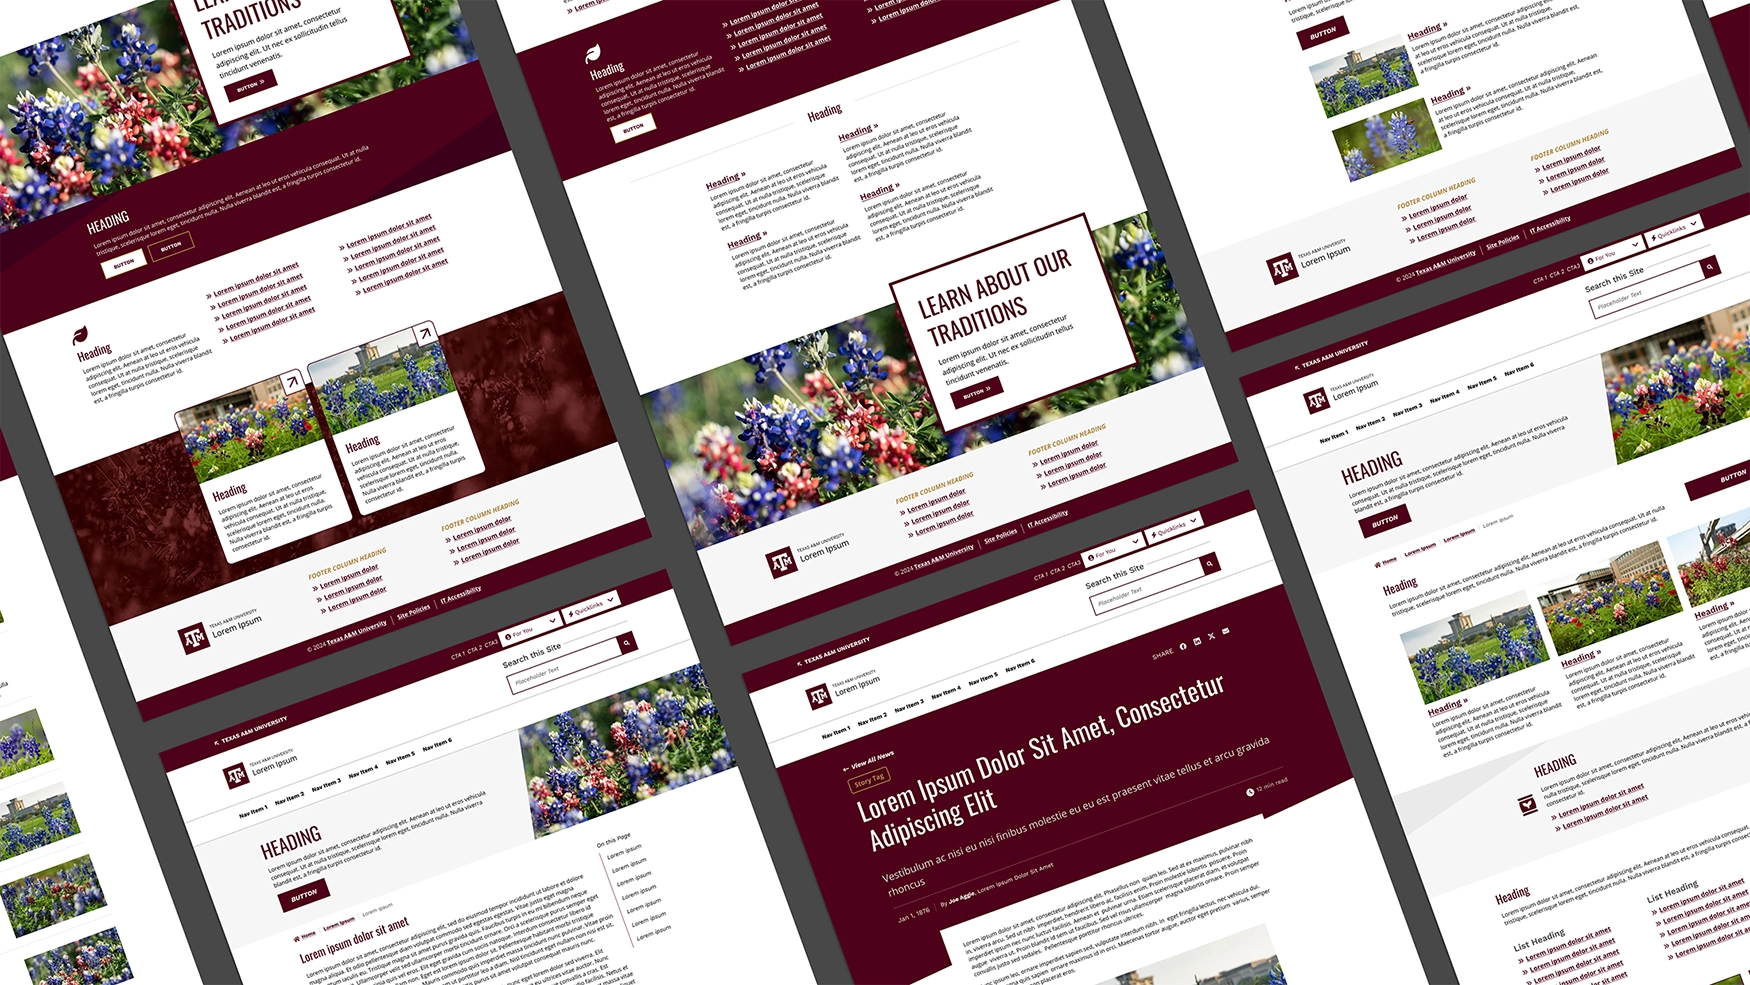
Aggie UX Templates
To help you get started building your website, we have provided a few example page templates with content recommendations and best practices.
Get Template TipsFrequently Asked Questions
Aggie UX can be used by Texas A&M University employees and vendors to create official Texas A&M websites or applications.
We have created a WordPress theme and Cascade CMS templates with an integrated Aggie UX page builder. With the page builder, you have access to dozens of components you can use as building blocks to create dynamic, engaging pages — all without having to know any code.
For those who want to use Aggie UX outside of these themes, you can use our HTML, CSS and JavaScript in your own projects. We offer direct, easy access to version-controlled, compiled CSS and JS via our CDN, and you can find the necessary HTML at aggieux.tamu.edu.
Aggie UX development was and continues to be guided by Web Content Accessibility Guidelines (WCAG) 2.1. As a public institution of higher education, we are required by law to meet Level AA standards. We use SiteImprove to help identify potential accessibility errors, including Level A, Level AA and WAI-ARIA authoring practices, and accessibility best practices. As new guidelines are published, we continually revisit our codebase to ensure that we meet these standards by both manual review and SiteImprove scans.
If you discover an accessibility issue with Aggie UX, please email us at web@tamu.edu and we will investigate the issue.
Aggie UX pulls colors, fonts, unit identities and visual style from the brand guide to create a polished, consistent experience across websites. Because our design system shares assets of the Texas A&M brand guide, when a user is directed to a website from a branded brochure or digital sign, there will be a consistent experience between media.
In some instances, colors and fonts may differ from those established in the brand guide. These deviations are strictly for use within the Aggie UX framework and should not be extended for use in print or digital materials such as brochures, emails or social media graphics.
Aggie UX provides a few customization options at the component level to make the design system as flexible as possible.
Styles can be applied at the component level, meaning a website can mix and match styles. Each website will have the default style available, and can choose to additionally use either bold or elegant. These predefined styles ensure all websites are brand compliant while providing ways to give individual sites their own personality and ways to emphasize different pieces of content.
Background options can also be used to introduce visual variety within a webpage or website.
Think of components as Lego pieces in a Lego set. Some pieces are more generic (like a basic brick), while others have very specific uses (like a wheel). Lego pieces can be combined in hundreds of different ways to make unique creations.
In the same way, components can be combined together to create visually interesting layouts for webpages. Aggie UX has dozens of different components, some for very specialized purposes (like displaying question and answer pairs) and some that are more flexible.
Using a web design system saves you time and money because you don’t have to “reinvent the wheel” on each website. Instead of starting from scratch on each project, you are able to focus on the unique needs for a given website and use your resources to address those issues.
Additionally, a web design system for the university improves the user experience of people navigating between Texas A&M websites. The consistent use of branding and familiar navigation patterns make it easier for users to recognize sites using Aggie UX as official Texas A&M websites and use them efficiently.
Multidisciplinary Skillsets
Learn how to enhance your reach and measure your impact through these multidisciplinary skillsets.
For marketing professionals, making digital content accessible means applying specific accessibility standards and content best practices in order to ensure a website, PDF files or other digital content can be navigated and understood by everyone, regardless of ability.
Measure the reach of your platforms and the success of your marketing materials by using analytics. Various platforms and tools can help you track, measure and report on data from your websites and more.
Search Engine Optimization (SEO) is about crafting the language you use in your online content and information architecture so that it is discoverable by search engines. Crafting your content with care can help extend your reach through search results.
GoWeb
Elevating web on campusGoWeb is an inclusive, collaborative community dedicated to supporting members and advancing web communication across campus. This community of practice is open to anyone, but content at each meeting is specifically tailored to support web designers, developers and web communicators across campus.
Learn More About GoWeb